KPI frameworks & performance
I define the metrics that matter, link them to your strategy and set up scorecards so every team knows where it stands.
 Senior BI & Data Analytics Consultant(LinkedIn profile, opens in a new tab)
Business + Intelligence. I connect strategy, KPIs and processes with the right data, so leaders make better decisions and teams keep improving.

Microsoft Certified: Power BI Data Analyst Associate (PL-300)
Realistic business scenarios built on sample data, showing how I approach common reporting problems.
Tap a project to read the case study.
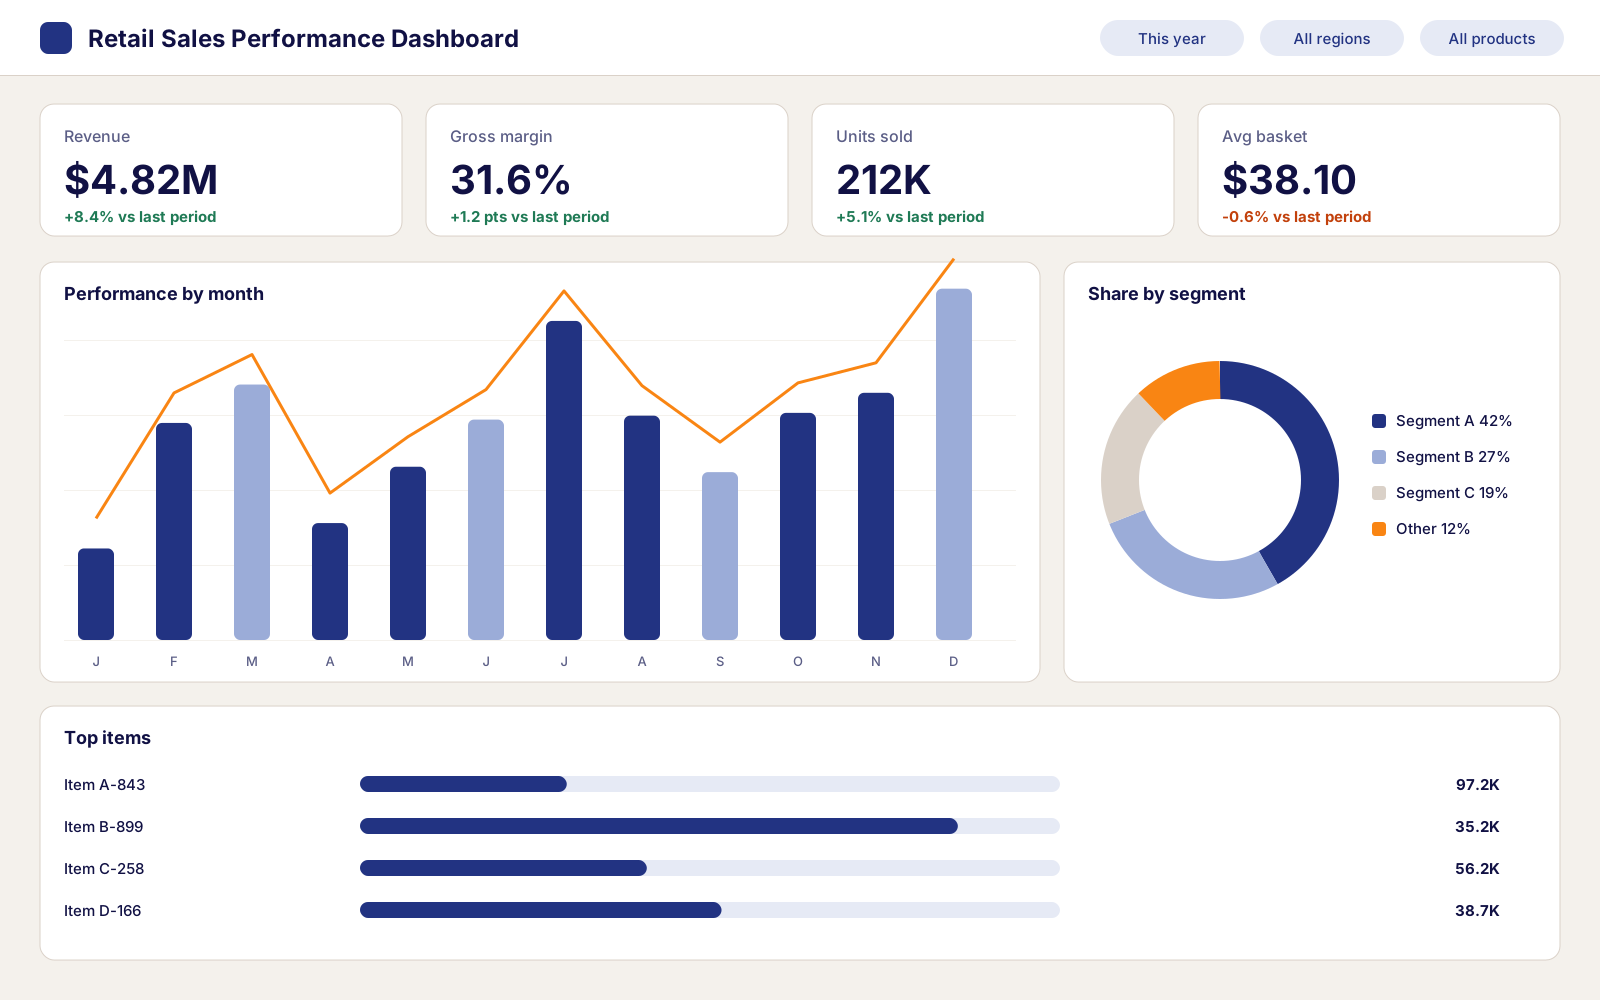
A single Power BI view of sales, margin and stock across 12 stores, designed to replace a weekly Excel pack that takes two days to build.
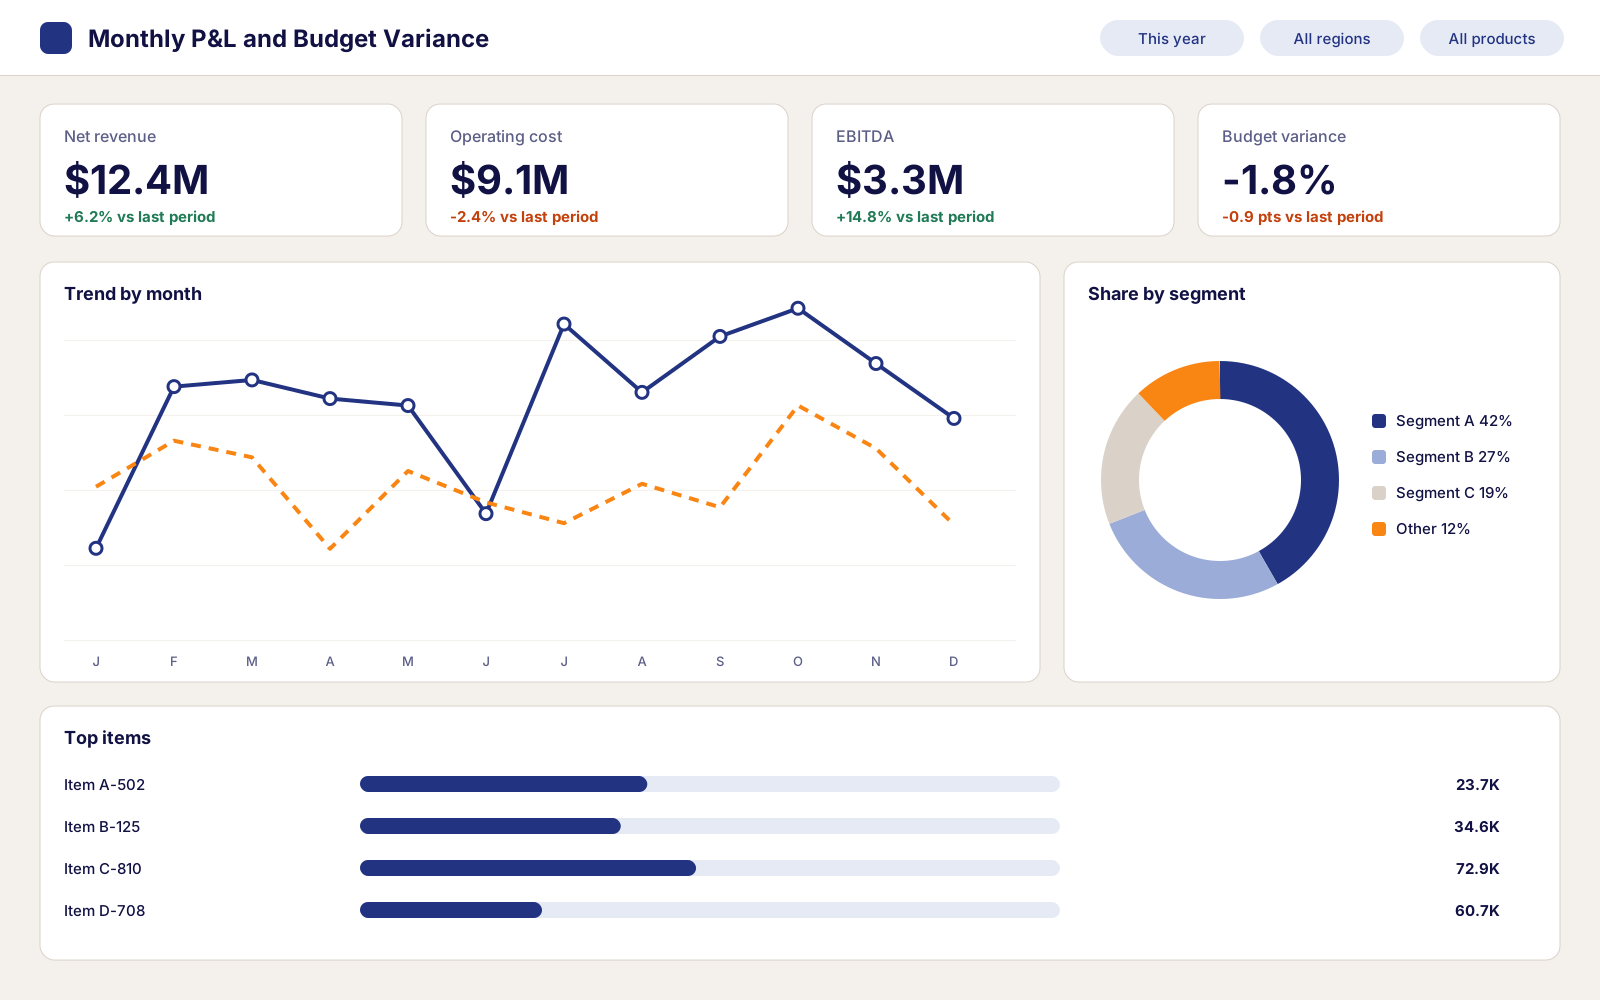
An automated profit and loss report with budget variance by department, designed to cut month-end reporting from five days to one.
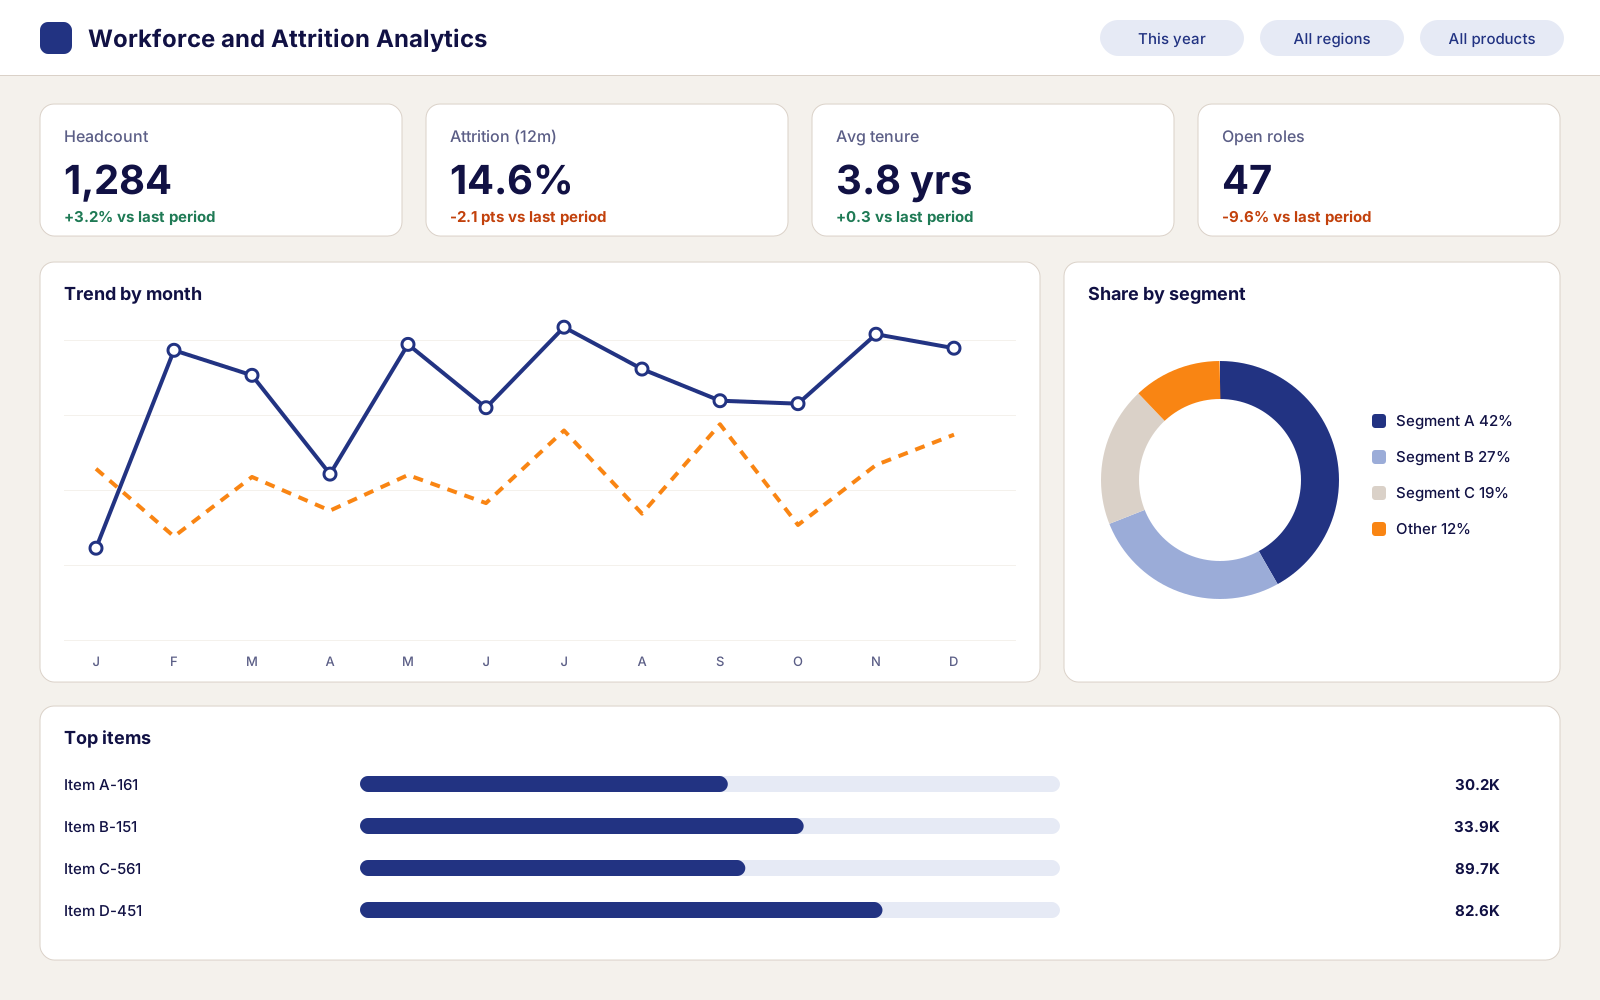
A Tableau dashboard that shows where and why people leave, so HR can act on retention before it becomes a hiring problem.
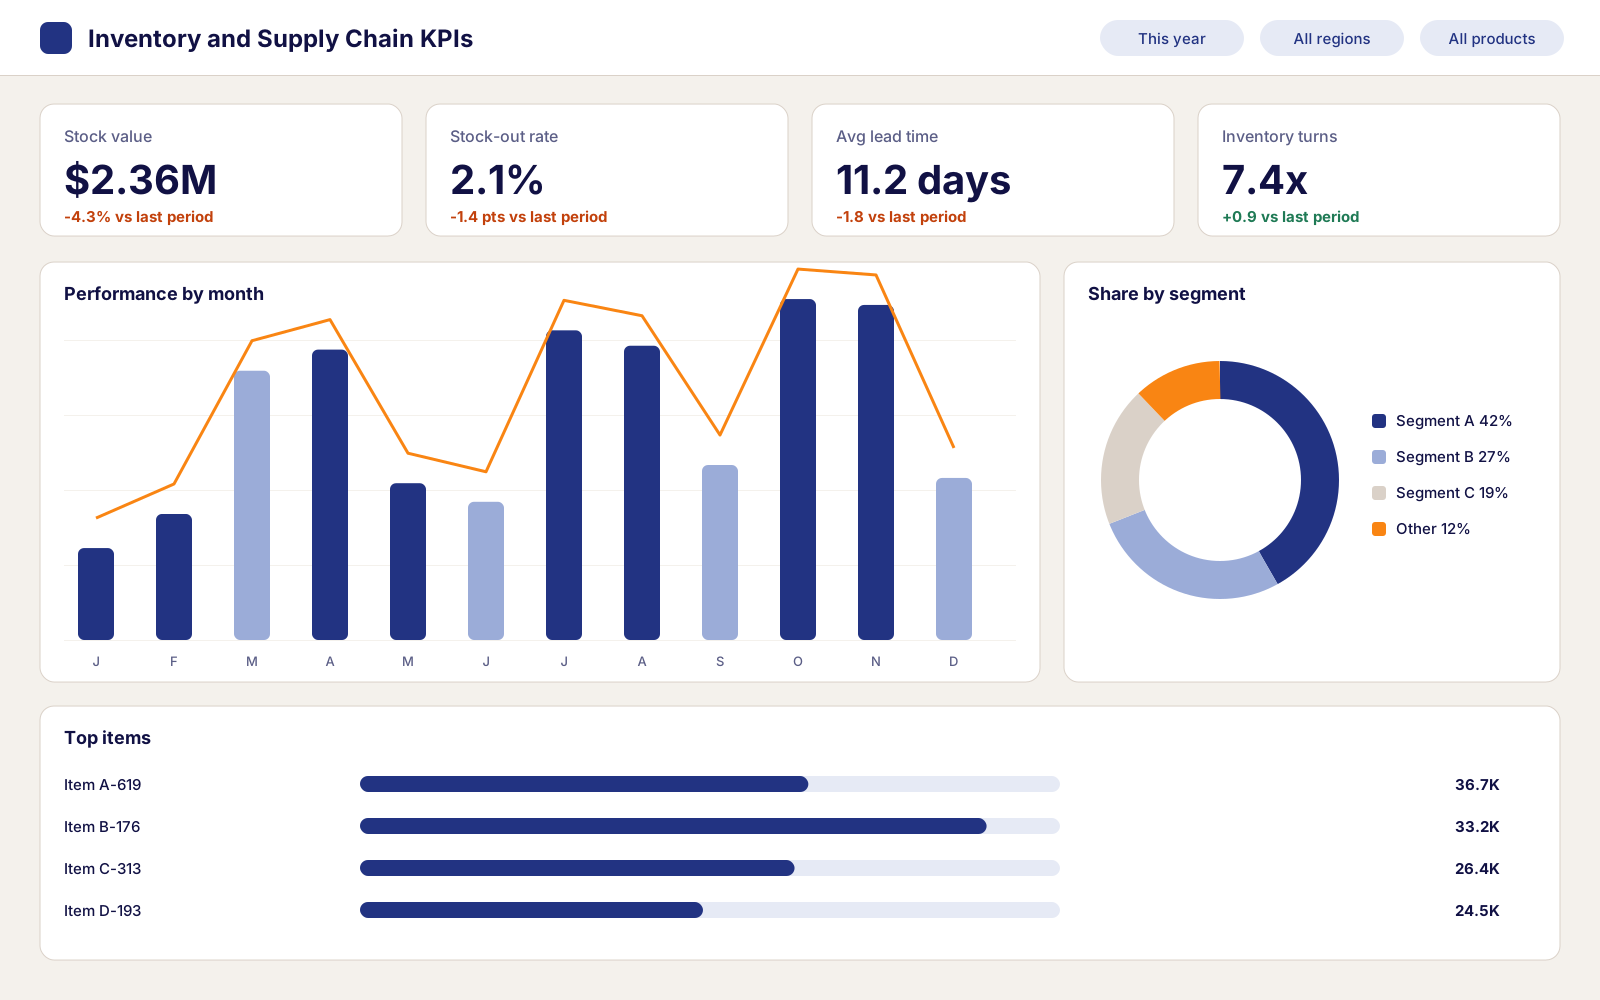
Stock levels, supplier lead times and stock-outs in one report, so the purchasing team orders the right amount at the right time.
A data-driven organization doesn't start with a dashboard. It starts with a clear strategy, a small set of KPIs everyone agrees on, and processes that produce data you can trust. Only then do BI and AI start paying off. That's the order I work in.
I define the metrics that matter, link them to your strategy and set up scorecards so every team knows where it stands.
I build Power BI and Tableau reports that leadership reads every week and acts on, with one trusted version of the numbers.
I map how work and data flow today, remove manual steps and automate reporting with data and AI tools.
I train your team to read, build and trust its own reports, and to use AI assistants safely in daily work.
I turn strategy into a short list of KPIs, each with an owner, a target and one clear definition.
Power BI and Tableau dashboards that answer real business questions in a few clicks.
Weekly and monthly packs that refresh themselves, so leaders get the same trusted numbers on time.
I map how work flows today, find the bottlenecks and remove the manual steps.
Hands-on training so your team can read, build and trust its own reports.
Practical, safe use of AI assistants for analysis, reporting and everyday work.
Proven platforms I use to collect, model, visualize and automate data, picked for the job rather than the trend.
 Power BIDashboards & BI
 TableauVisual analytics
 ExcelModeling & analysis
 SQL ServerQuerying data
 PythonAnalysis & automation
 Google AnalyticsWeb & digital analytics
 SharePointData collection
 Power AutomateWorkflow automation
 ClaudeAutomation & coding
 ChatGPTAI assistance
 GeminiAI integration

Senior Business Intelligence and Data Analytics Consultant with 7+ years helping organizations turn KPIs, processes and data into better decisions.
7+
years in BI and analytics
20+
BI solutions delivered
70%
faster report delivery
Industry Agnostic
KPI frameworks that fit any sector

Microsoft - 2025

Microsoft - 2026

Google, via Coursera - 2025

Google, via Coursera - 2024
The company is testing investor appetite amid market volatility
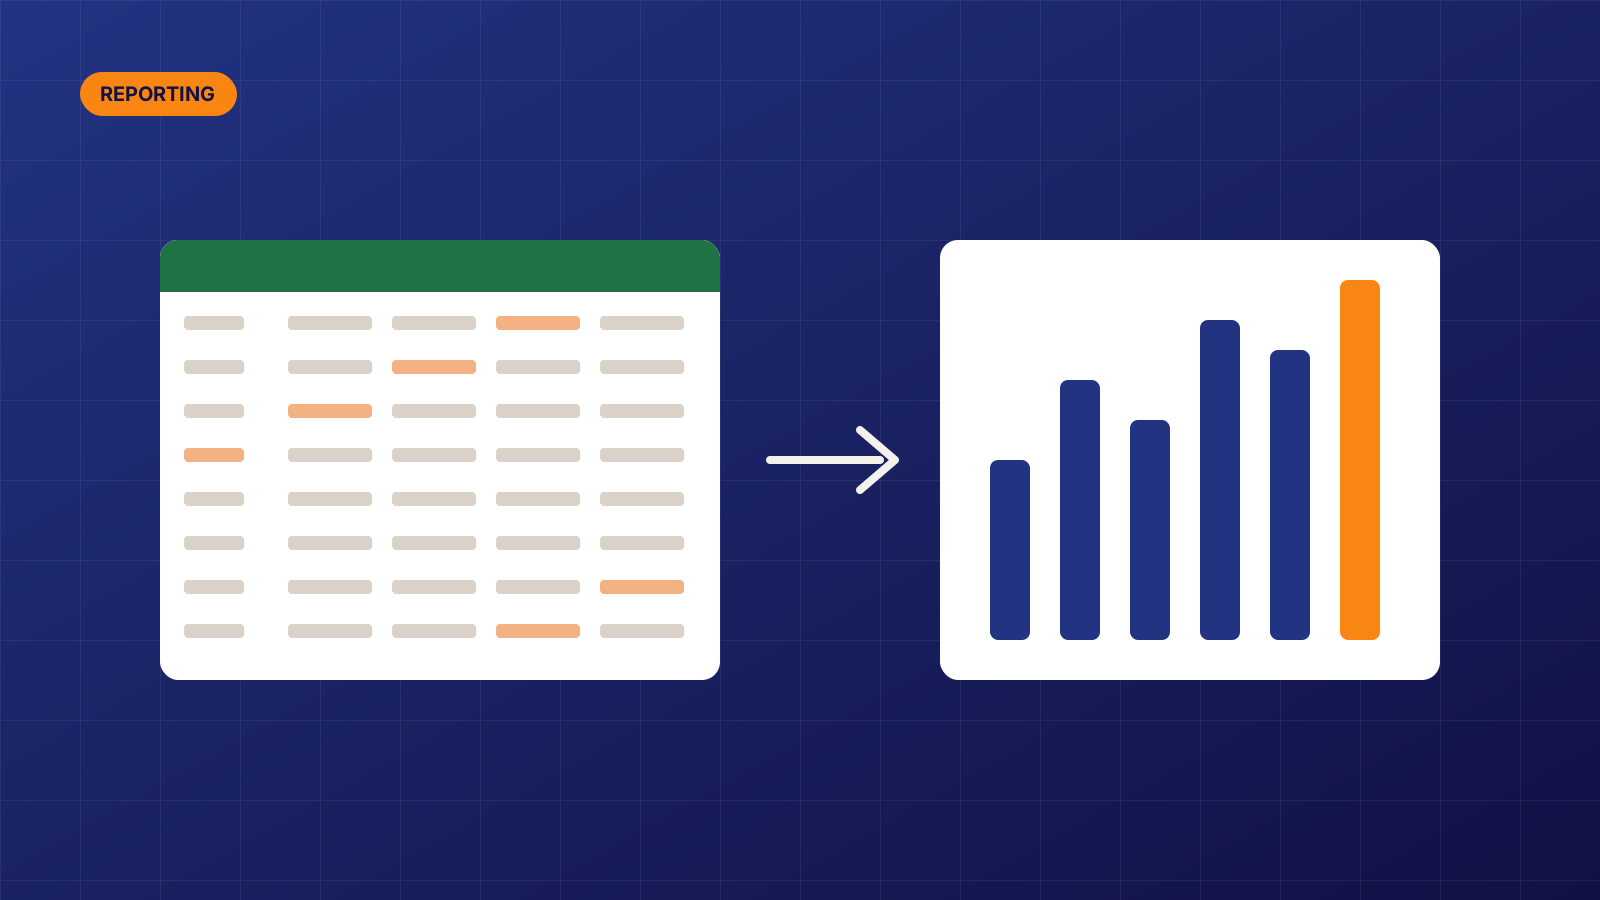
Excel is a great tool, until your weekly report takes two days to build. Here are five signs it is time for a proper reporting setup.
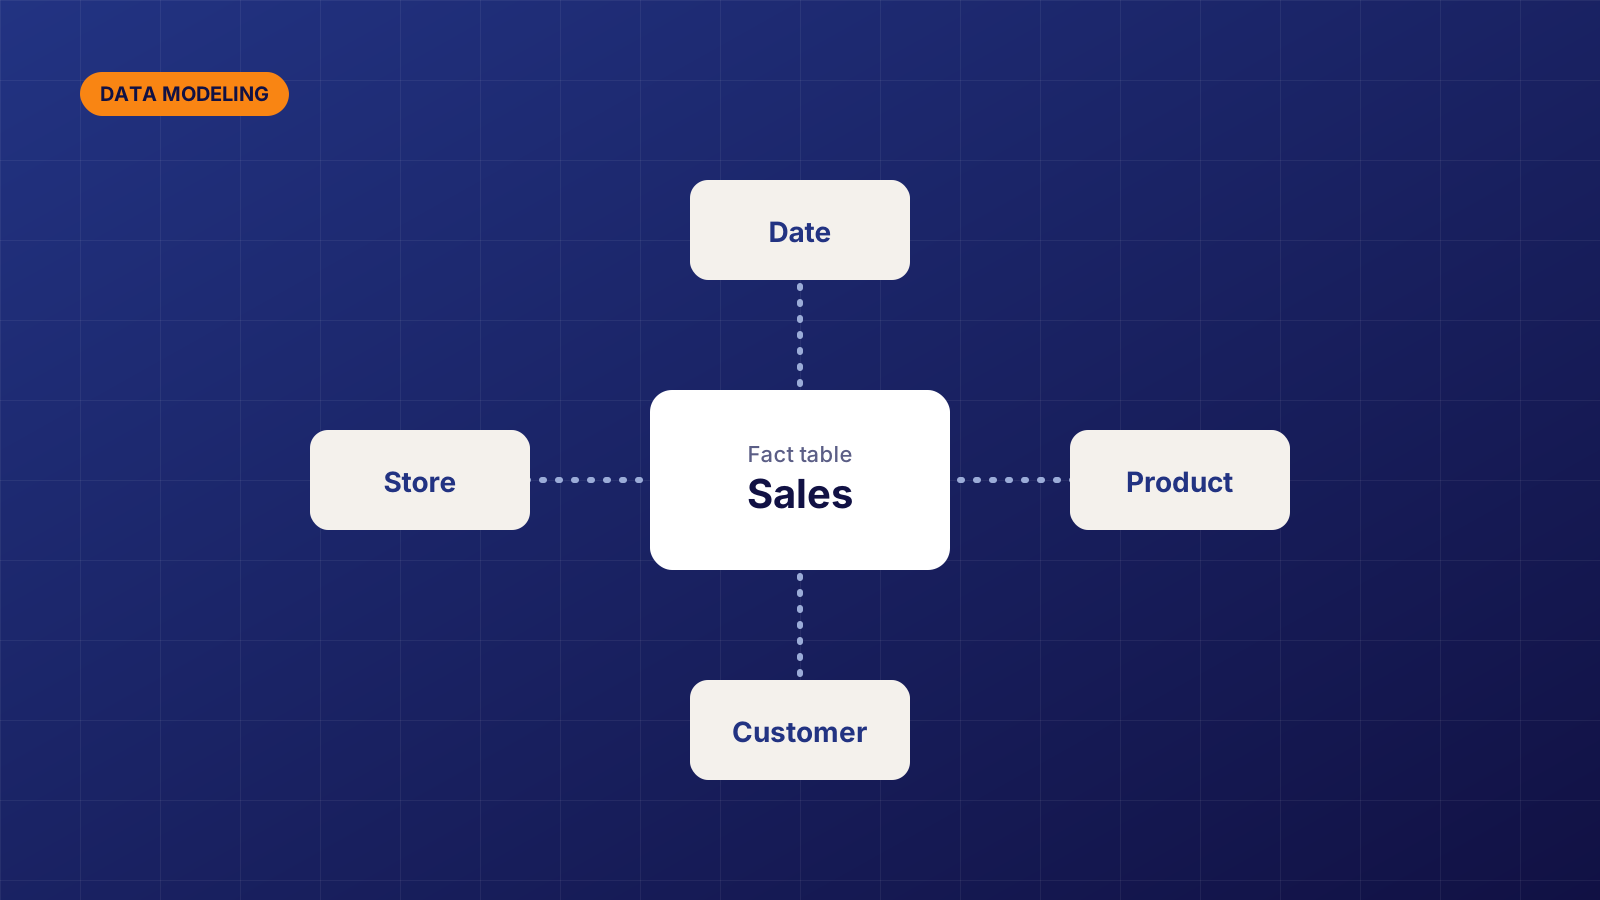
The star schema sounds technical, but the idea is simple. Here is what it is, and why it makes your dashboards faster and your numbers more reliable.
Have a question, an idea or just want to say hello? Send me a message and I'll get back to you.