Inventory and Supply Chain KPIs
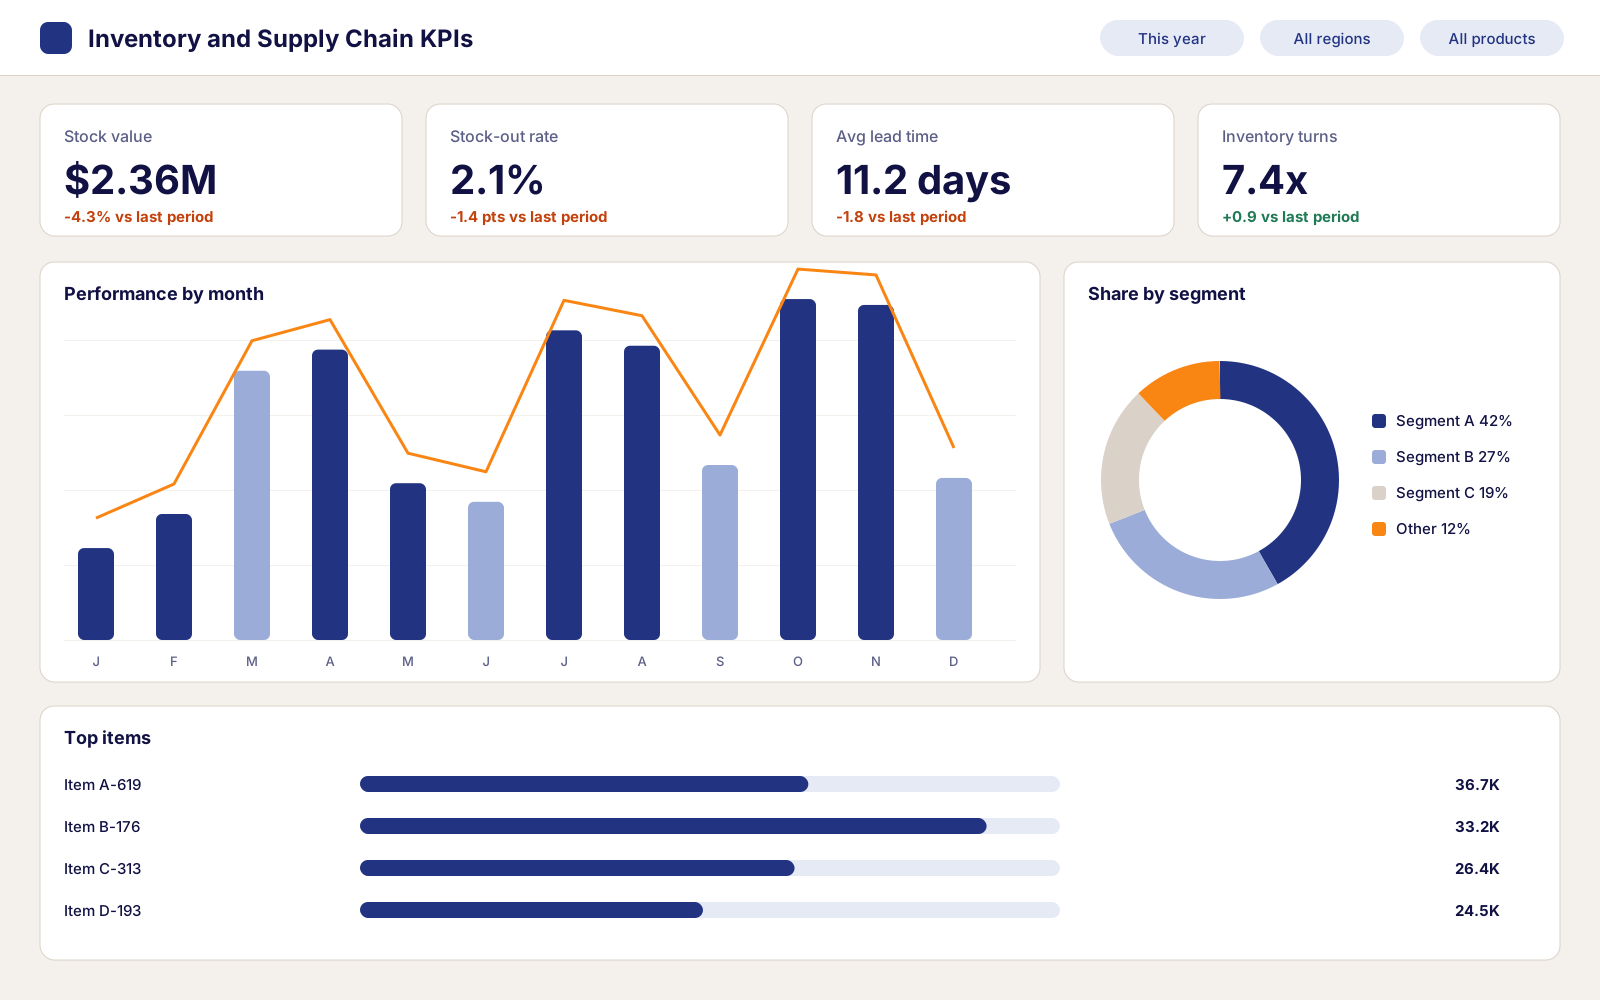
Stock levels, supplier lead times and stock-outs in one report, so the purchasing team orders the right amount at the right time.
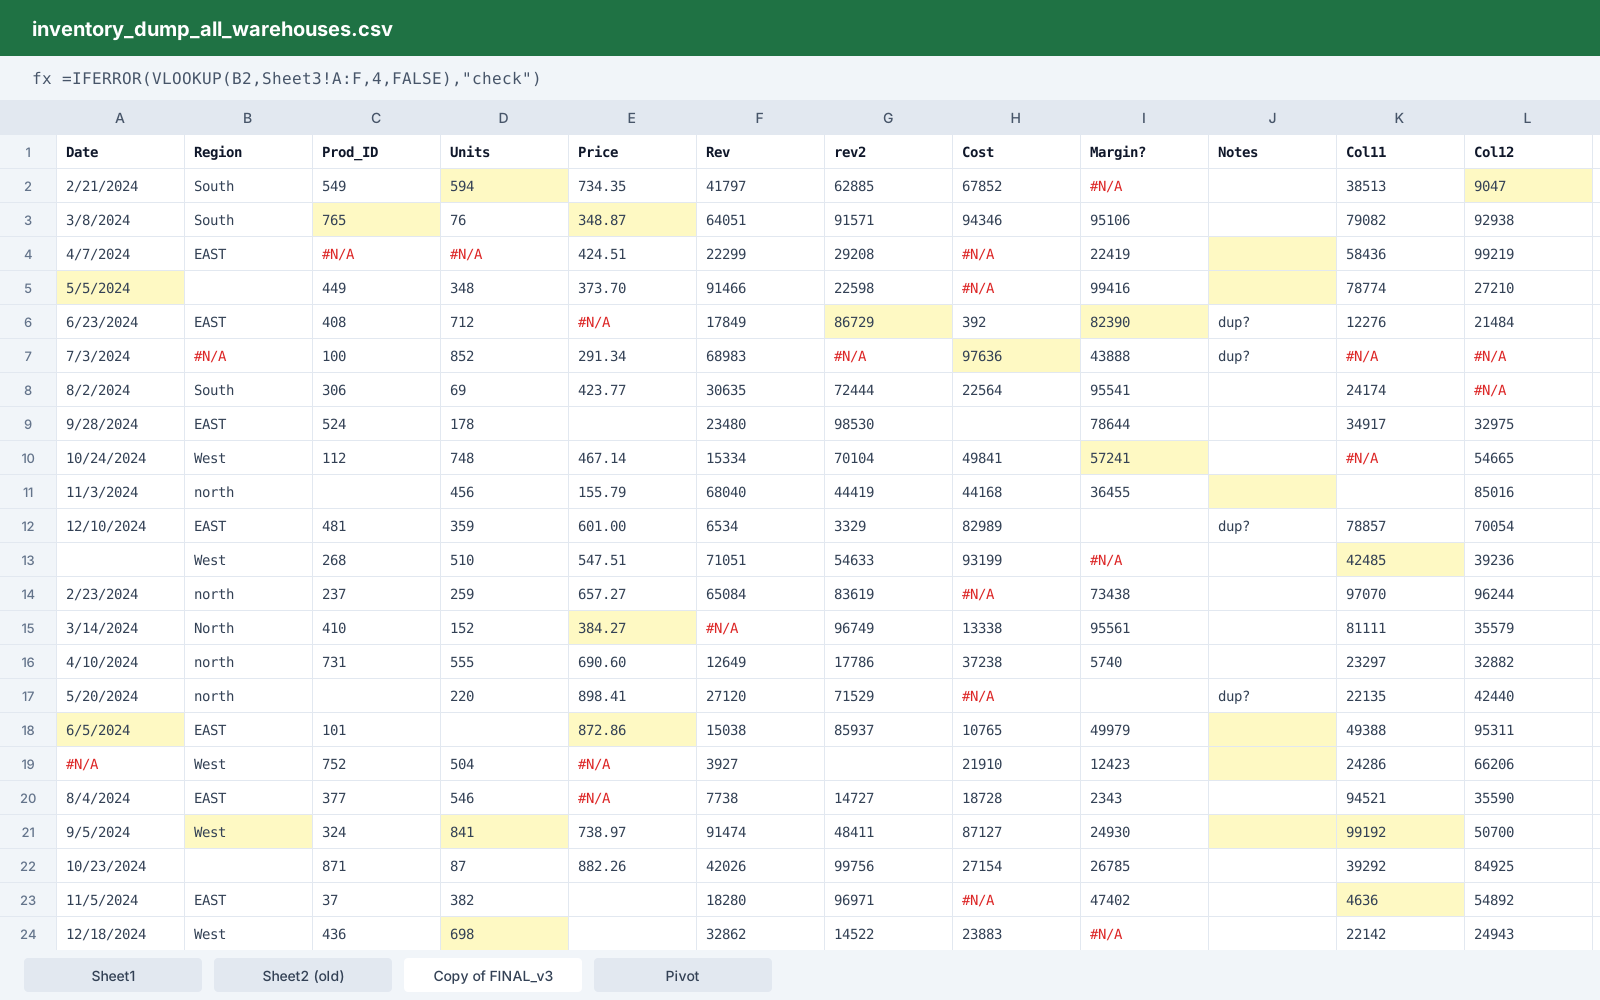
Drag the handle to compare the raw data with the finished dashboard.
3 warehouses
in one model
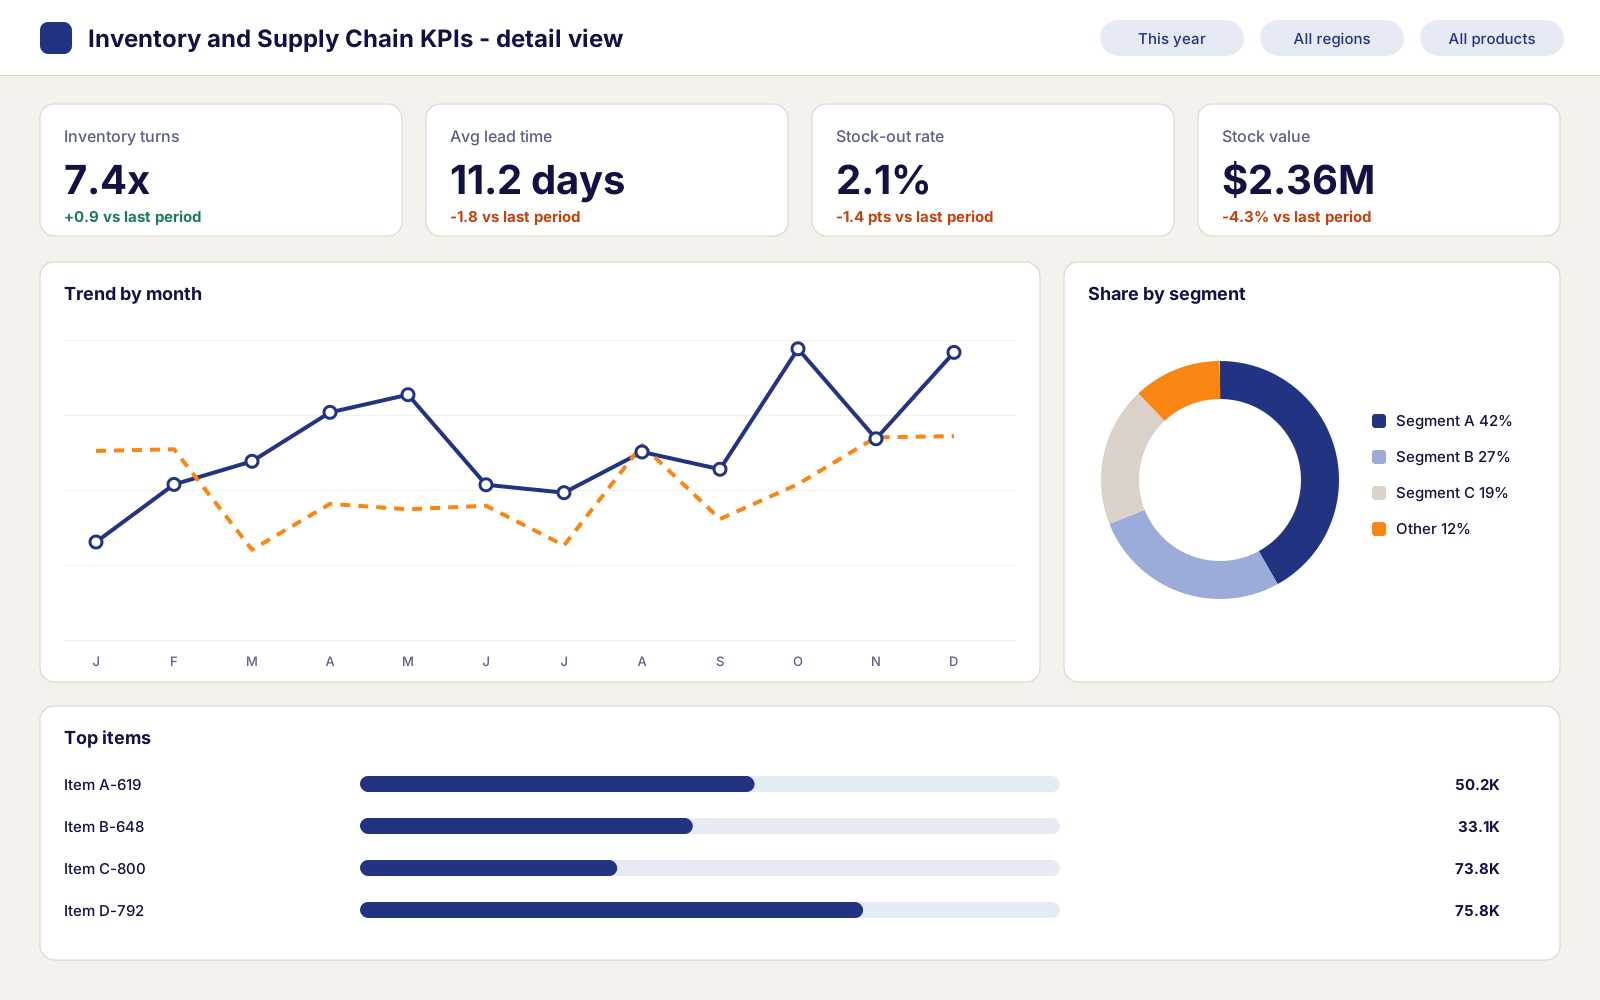
4 KPIs
stock cover, stock-outs, lead time and turns
180 days
without a sale flags excess stock
The scenario
A distributor with three warehouses runs purchasing from a separate stock report for each site. Some items run out every month while others sit on the shelf for a year, and lead times are tracked from memory.
The data
Sample inventory snapshots from three warehouse systems, purchase orders, supplier deliveries and sales history, combined in SQL. Units of measure differ between warehouses, so I added a conversion table.
My approach
The report tracks a small set of KPIs: stock cover, stock-out rate, lead time and turns. It flags items below their reorder point and suppliers whose delivery times are slipping.
What it changes
Purchasing gets one list of what to reorder now and which suppliers to chase. Items with no sales in 180 days stand out, so excess stock can be cleared before it ties up more cash.
Dashboard gallery
Hiring, or looking for a BI partner?
I'm open to senior BI and analytics roles and to selected consulting projects. Tell me what you're working on and I'll get back to you within 1 to 2 business days.