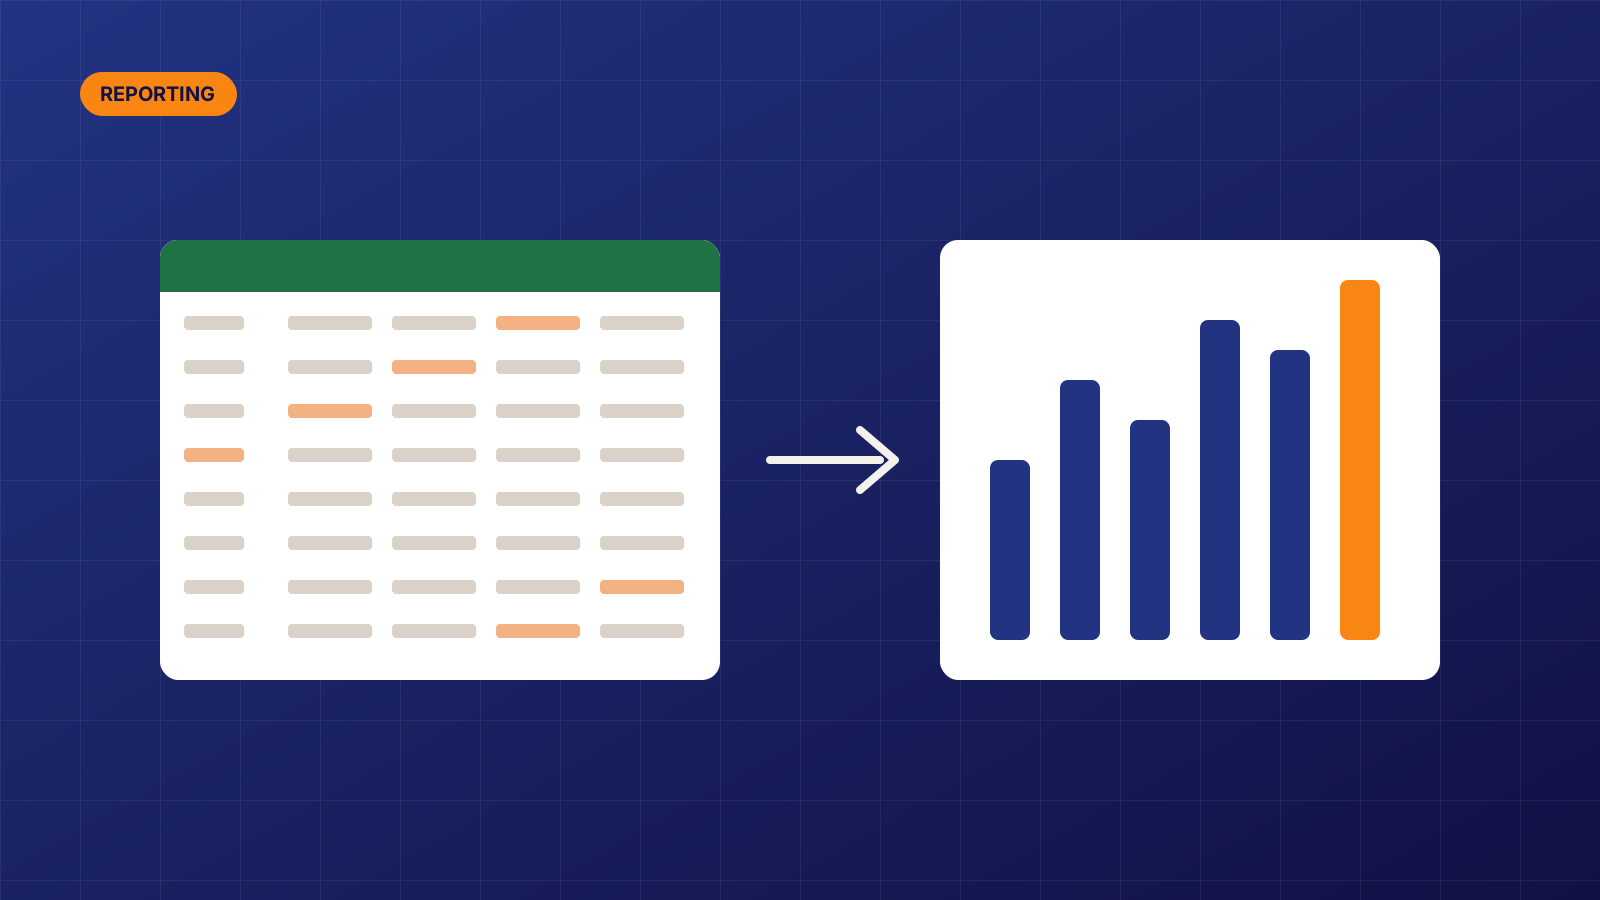
If you have worked with an analyst, you may have heard them talk about a “star schema”. It sounds like jargon, but it is one of the most useful ideas in reporting, and you do not need to be technical to understand it.
The short version: facts and dimensions
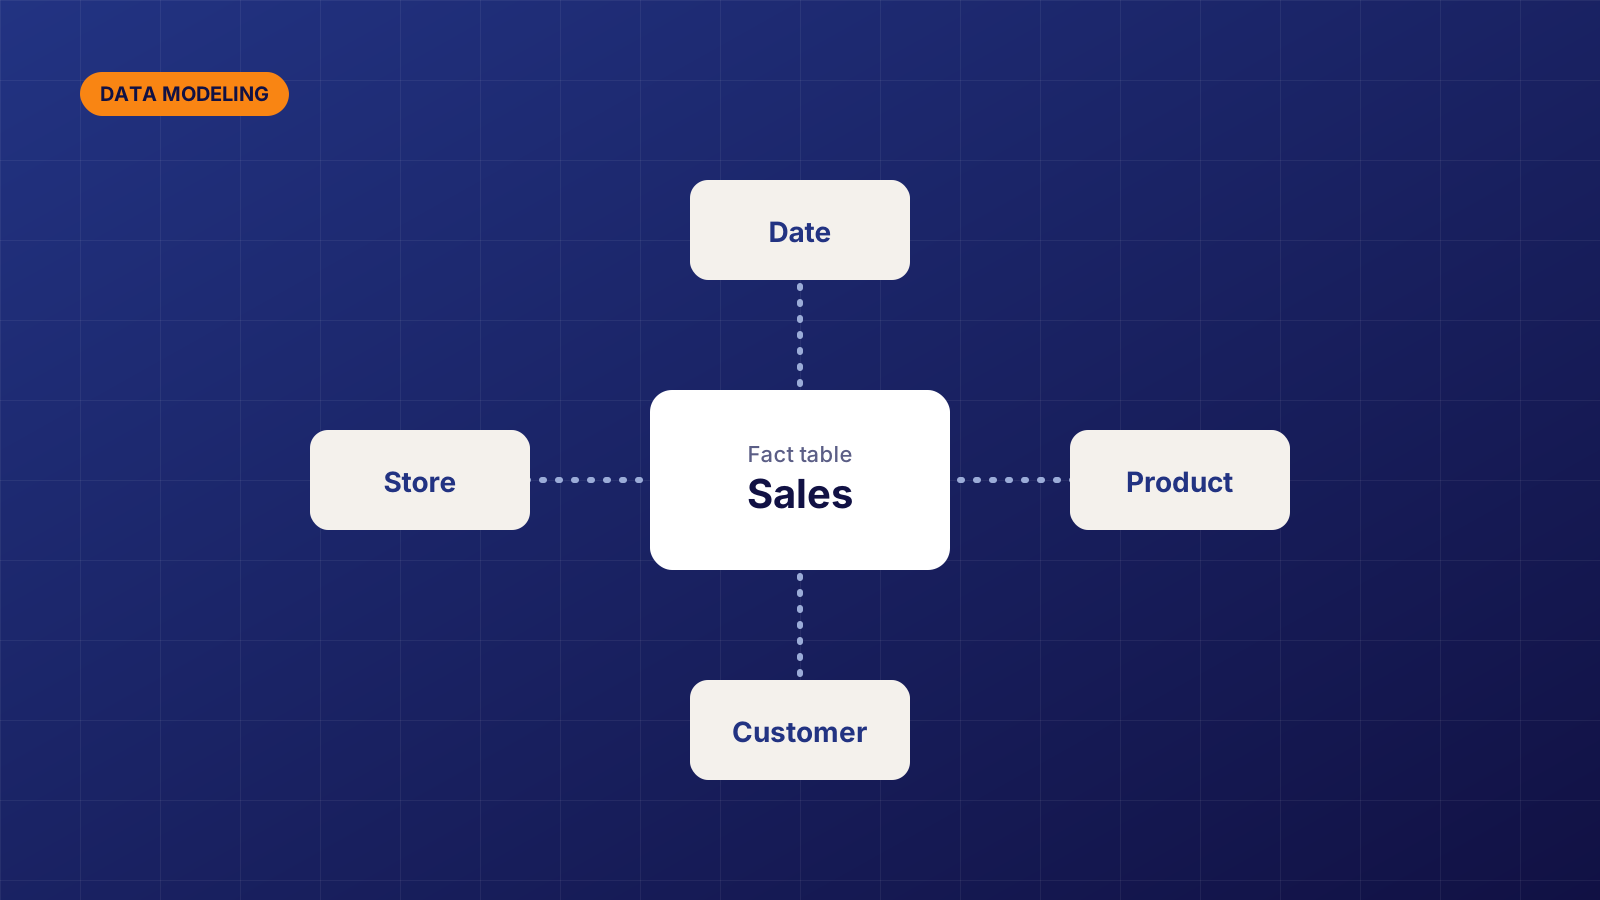
A star schema splits your data into two kinds of tables. Fact tables record things that happened, such as sales, orders or support tickets. Each row is one event with numbers attached, like quantity and revenue.
Dimension tables describe those events. Who was the customer? Which product? Which store? What date? Each dimension sits around the fact table, and when you draw it, it looks like a star.
An everyday example
Think of a till receipt. The line items are the facts: two coffees, one sandwich, total amount. The details printed at the top are the dimensions: the store, the date, the cashier. You would never reprint the full store address on every line. You print it once and refer to it. A star schema does the same with your data.
Why it matters to you
- Faster reports. Tools like Power BI are built to work with this shape, so pages load quickly even with millions of rows.
- Consistent numbers. Revenue is defined once, in one place, so every report shows the same total.
- Easier new questions. Want to see sales by region instead of by store? If the dimension exists, it is a filter, not a new project.
What happens without it
Many reports are built on one huge flat table, or on dozens of tables joined in different ways for each chart. That works at first, but it gets slow, numbers start to double count, and every change risks breaking something else.
Questions to ask your analyst
- What are our main fact tables, and what does one row represent?
- Which dimensions can we filter by today?
- Where is each key metric defined?
If the answers are clear, your reporting has a solid foundation. If not, that is usually the best place to start improving it.