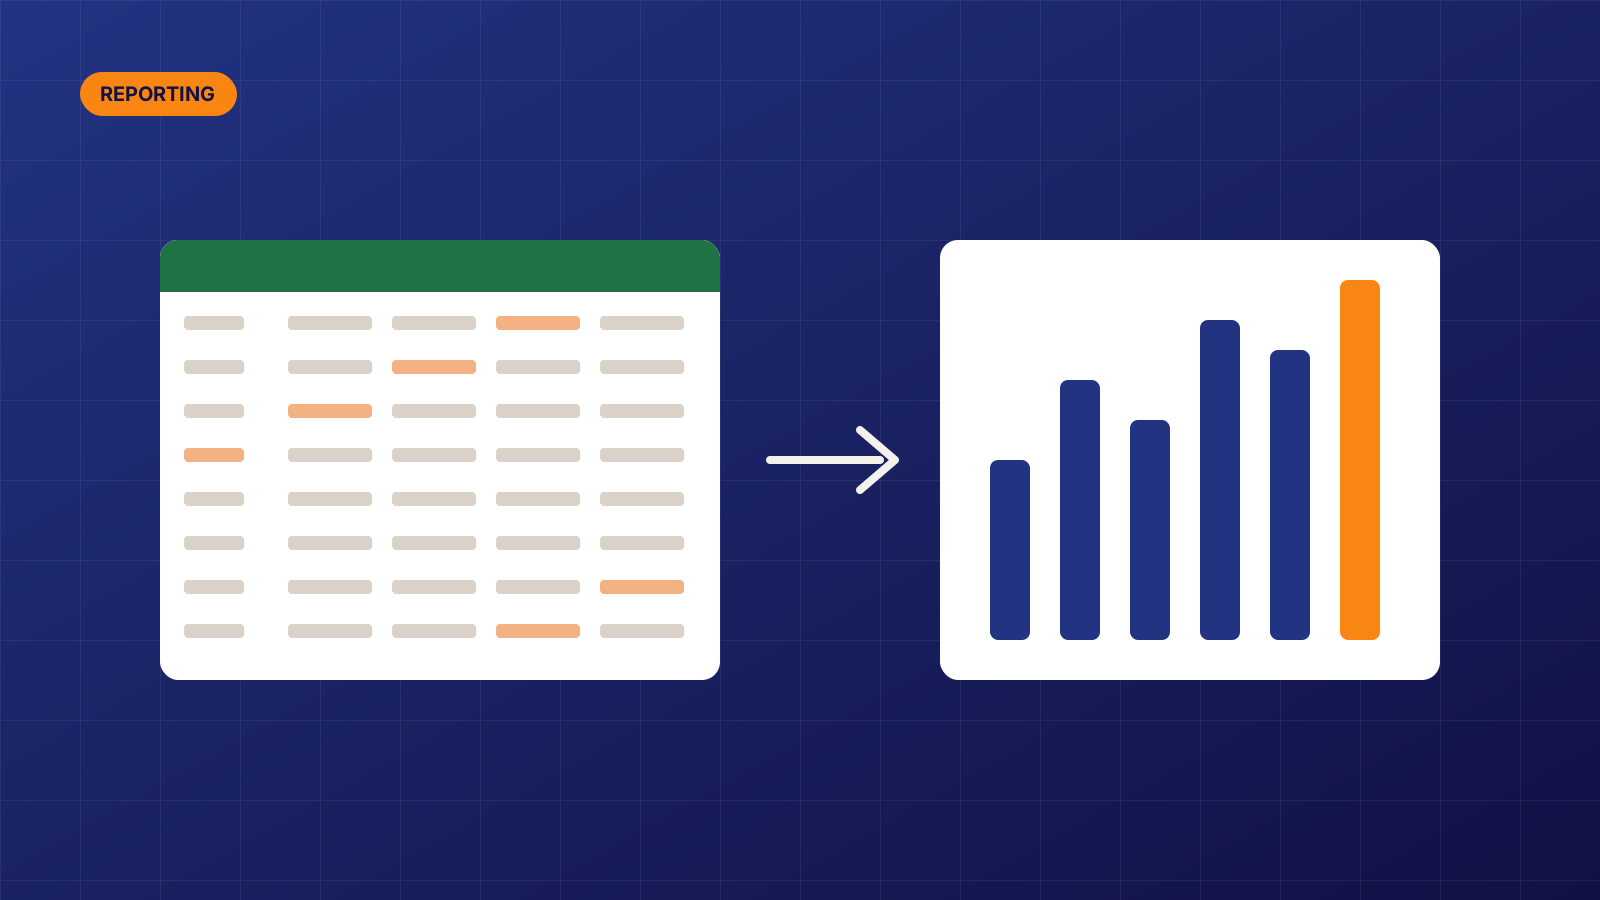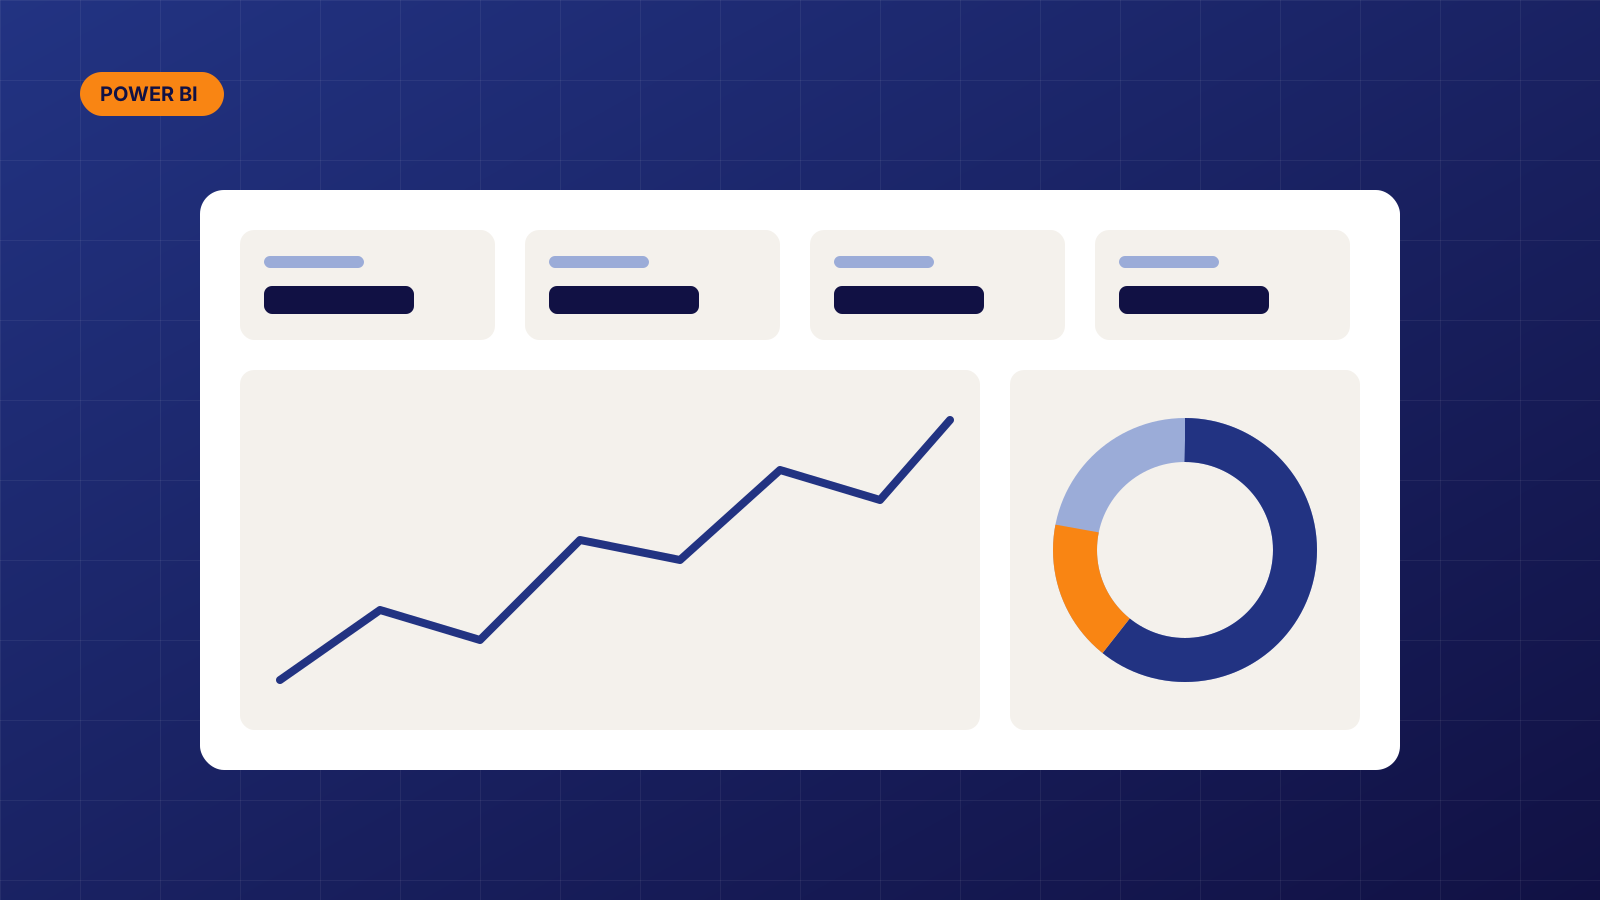
People often expect a dashboard project to start with charts. In my experience, the charts are the last 20% of the work. Here is the process I follow, and why each step matters.
1. Start with the decisions
Before opening Power BI, I sit down with the people who will use the report and ask what decisions they make each week, and what information they wish they had. Every page of the final dashboard should answer one of those questions.
2. Find and check the data
Next I map where the data lives: databases, exports, spreadsheets, APIs. I check a sample of each source for gaps, duplicates and odd values. It is much cheaper to find a data problem now than after the dashboard is live.
3. Clean and model
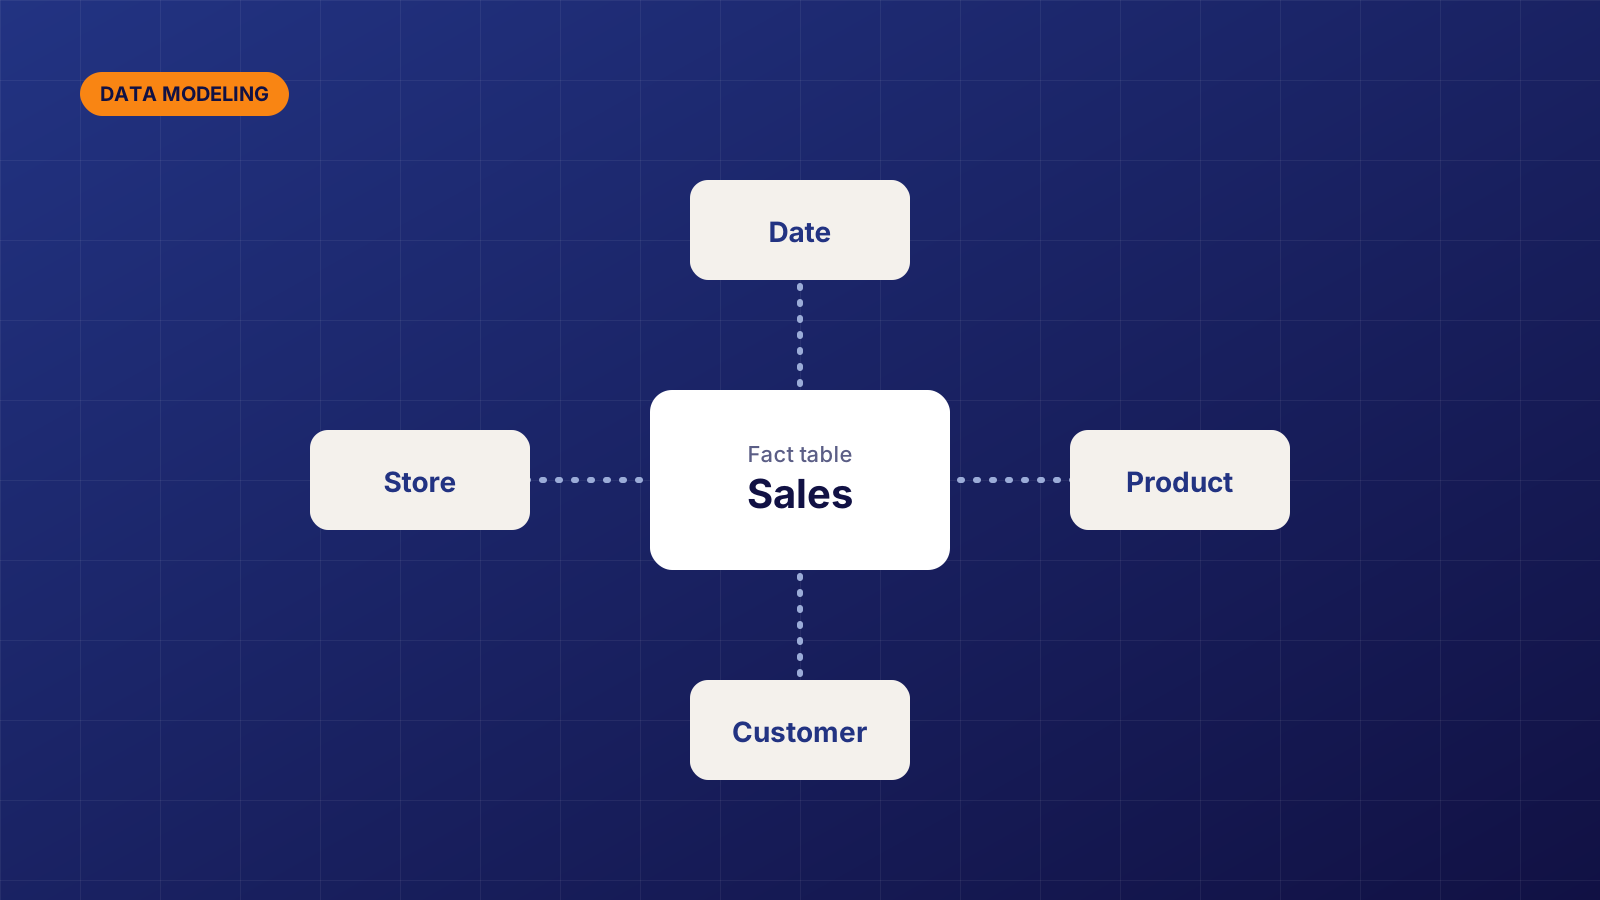
I use Power Query to clean and combine the sources, then build a star schema with fact and dimension tables. This is where key metrics like revenue, margin or attrition get one clear definition that every visual will reuse.
4. Design for the reader
A good dashboard is easy to scan. A few rules I stick to:
- The most important number goes in the top left.
- One page answers one question.
- Use colour to highlight, not to decorate.
- Every chart gets a title that says what it shows.
5. Test with real users
I share an early version and watch people use it. Where do they click? What do they ask? Small changes at this stage, like renaming a measure or moving a filter, make a big difference to adoption.
6. Hand off and train
Finally, I set up the scheduled refresh, write short documentation and run a walkthrough with the team. The goal is that the dashboard keeps working long after the project ends, without depending on me.
If you have a report that takes too long to build or that nobody trusts, this process is a good place to start.